Note
Click here to download the full example code
Time domain averaging: Atmospheric tides
Dawson introduced the summation procedure for detecting tiny but regular time-varying brain responses to stimulation embedded in the irregular fluctuations of background EEG ([Dawson1954]). He noted that the idea of aggregating noisy measurements was already well known and pointed to Laplace’s early 19th century attempt to detect tiny but regular lunar gravitational pressure tides in the atmosphere, embedded in the larger fluctuations of barometric pressure driven by other factors, e.g., solar warming, weather systems, seasonal variation.
The subject of atmospheric lunar tides is complex and has a rich scientific history ([LinCha1969]). This example it is not a serious model of the phenomenon, but rather an illustration of how event-related regression modeling, in this case simple averaging, can “see through” large unsystematic variation and find systematic time-varying patterns.
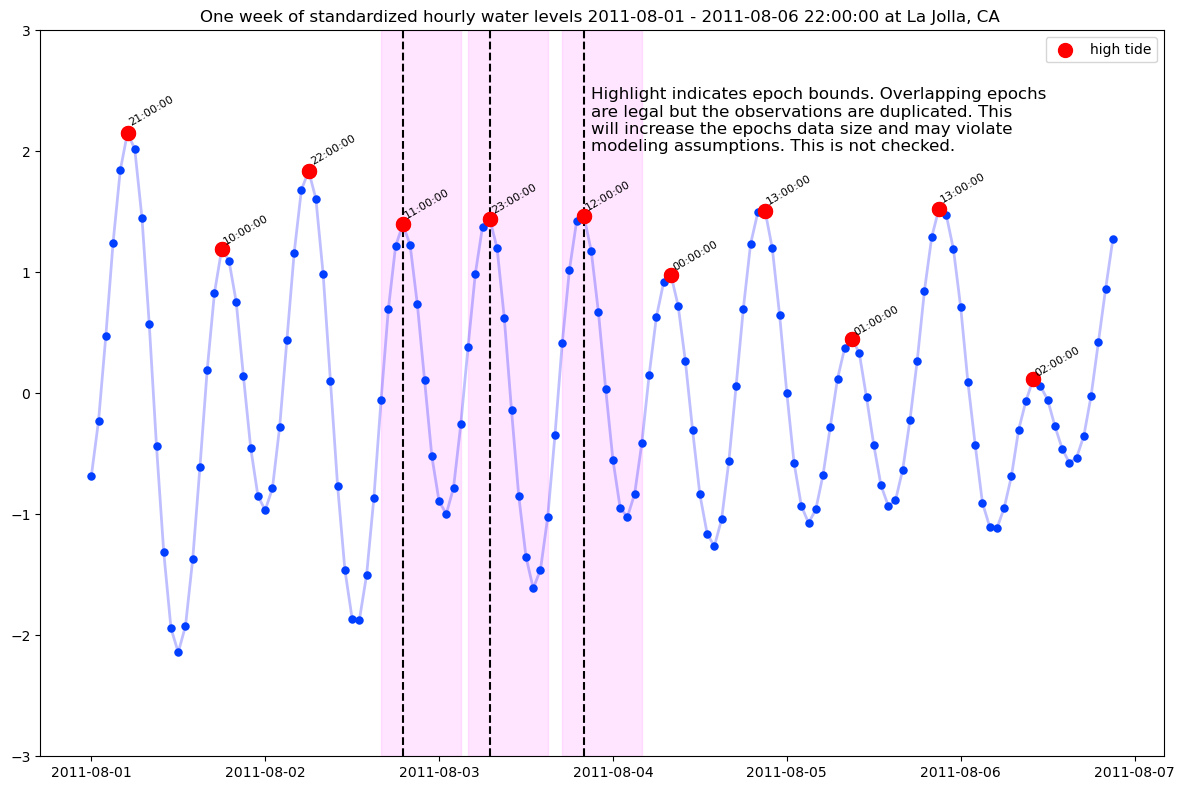
Data are from NOAA Station La Jolla, CA 94102 (Scripps) August 1, 2010 - July 1, 2020 sea level and meteorology data, downloaded January 29, 2020 from https://tidesandcurrents.noaa.gov. Water levels are measured relative mean sea level (MSL). For more on how the epochs data were prepared see NOAA tides and weather epochs.
from pathlib import Path
import numpy as np
import pandas as pd
from pandas.plotting import register_matplotlib_converters
from matplotlib import pyplot as plt
import fitgrid as fg
from fitgrid import DATA_DIR

# set up plotting
plt.style.use("seaborn-bright")
rc_colors = plt.rcParams['axes.prop_cycle'].by_key()['color']

# supress datetime FutureWarning (ugh)
# register_matplotlib_converters()

# path to hourly water level and meteorology data
WDIR = DATA_DIR / "CO-OPS_9410230"

data = pd.read_hdf(DATA_DIR / "CO-OPS_9410230.h5", key="data")
epochs_df = pd.read_hdf(DATA_DIR / "CO-OPS_9410230.h5", key="epochs_df")
epochs_df.drop(columns=["air_temp", "air_temp_z"], inplace=True)

# compute epochs time domain average
epochs_tda = epochs_df.groupby('time').mean().reset_index('time')
Event-related data modeling
Epochs are segments of recorded data, time stamped relative to an event of interest.
For this illustration:
The data channels include water level (meters), barometric
pressure (mm Hg) recorded hourly at Scripps Pier in La Jolla and the standardized scores (centered, scaled by the standard deviation).
For comparing the measured time-series data with random variation, an additional channel is created with a sequence of values sampled from a standard normal distribution.
The epochs segments are 12 measurements beginning 3 hours before high tide at Time (hour) = 0.
The epochs data frame looks like this:
epochs_df
The first few hundred epochs are shown (thin lines), along with the overall 10 year average (thick line).
measures = ['water_level_z', 'mm_hg_z', 'std_noise_z']
alpha = 0.025

fig, axs = plt.subplots(len(measures), 1, figsize=(8, 8), sharey=True)
cnt = 0

# select a batch of individual epochs for illustration
epids = epochs_df.index.unique("epoch_id")[:512]
for _, vals in epochs_df.query("epoch_id in @epids").groupby('epoch_id'):
    vals.reset_index('time', inplace=True)
    for axi, measure in enumerate(measures):
        axs[axi].plot(
            vals['time'], vals[measure], color=rc_colors[axi], alpha=alpha
        )

# overplot the 10 year time-domain average
for axi, measure in enumerate(measures):
    if axi == 0:
        axs[axi].text(x=0, y=4.25, s="high tide", ha="center")
    axs[axi].axvline(0, color="k", ls="--")
    axs[axi].set_title(measure)
    axs[axi].plot(
        epochs_tda['time'], epochs_tda[measure], color=rc_colors[axi], lw=2
    )
    axs[axi].set(xlabel="Time (hours)", ylabel="Standard Deviation (SD)")
fig.tight_layout()
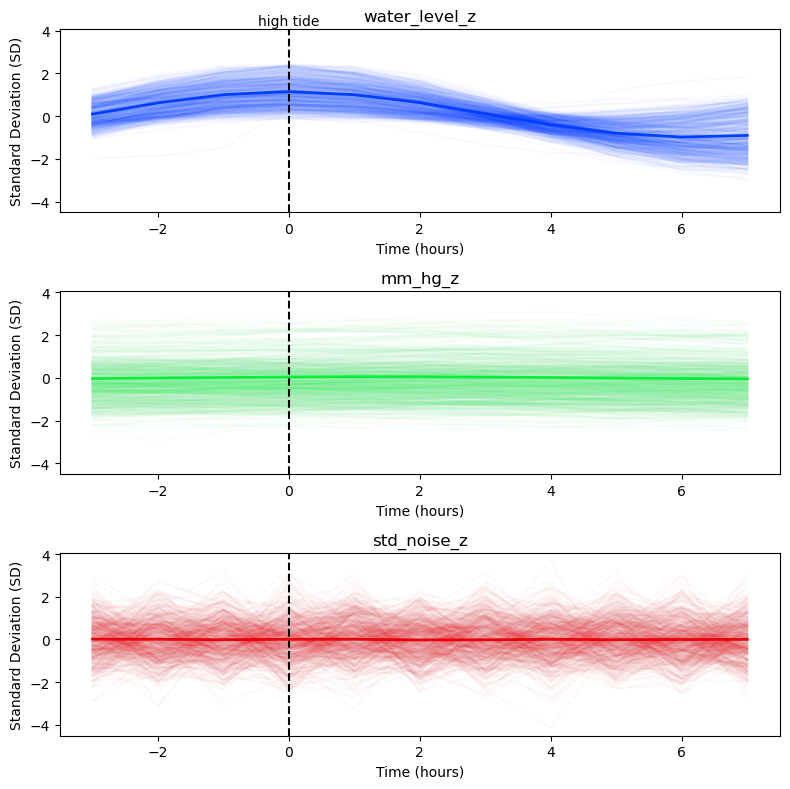
The time course of the water levels (blue) shows epoch-to-epoch variation and, by construction, the rise and fall around the peak at high tide (Time = 0) for individual epochs and on average.
The barometric atmospheric pressure data (green) are also time-aligned to high tide. They vary from epoch to epoch but individual epochs vary little over time and the 10-year average appears approximately flat.
The standard normal data (red) are shown for comparison. Unlike the water levels, the amplitude variation over time is not systematic and the 10 year average appears approximately flat.
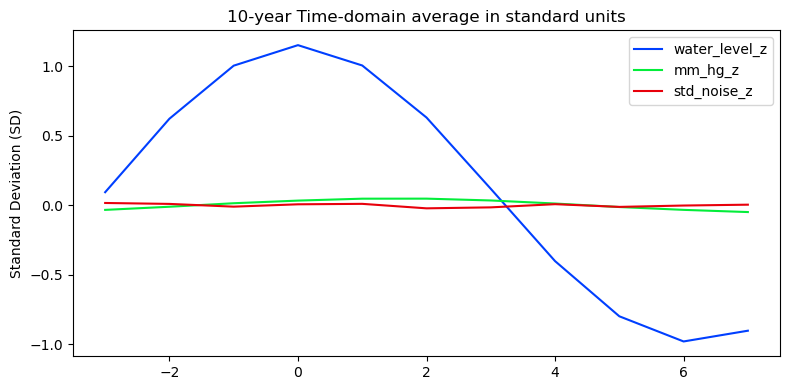
The next figure shows these same 10-year averages. The oceanic tide is obvious but there is no clear indication of a corresponding atmospheric tide. On average, the barometric pressure looks not much different than the random variation.
fig, ax = plt.subplots(figsize=(8, 4))
for midx, meas in enumerate(measures):
    ax.plot(epochs_tda.time, epochs_tda[meas], color=rc_colors[midx])
ax.legend(measures)
ax.set(ylabel="Standard Deviation (SD)")
ax.set_title(f"10-year Time-domain average in standard units")
fig.tight_layout()
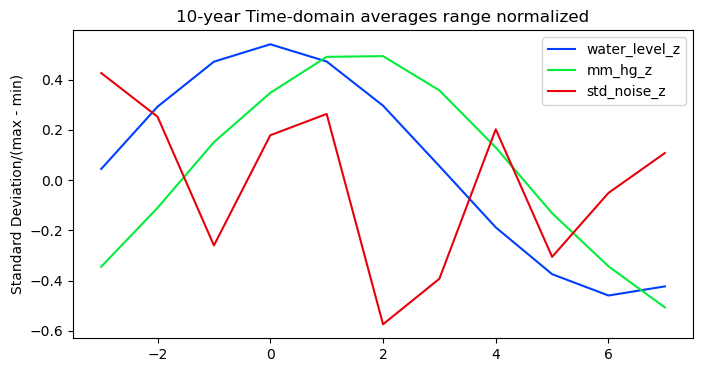
This appearance, however, is misleading. When the 10-year averages are normalized by their range there is a clear barometric rise and fall at about a two-hour delay relative to water level. The scaled average random variation shows no such pattern. The barometric measurements of the lunar atmospheric tide are an order of magnitude smaller than the water level measurements but detectable none the less with enough data to average out the large but irregular sources of pressure variation.
fig, ax = plt.subplots(figsize=(8, 4))
for midx, meas in enumerate(measures):
    meas_range = epochs_tda[meas].max() - epochs_tda[meas].min()
    ax.plot(
        epochs_tda.time, epochs_tda[meas] / meas_range, color=rc_colors[midx]
    )
ax.legend(measures)
ax.set(ylabel="Standard Deviation/(max - min)")
_ = ax.set_title(f"10-year Time-domain averages range normalized")
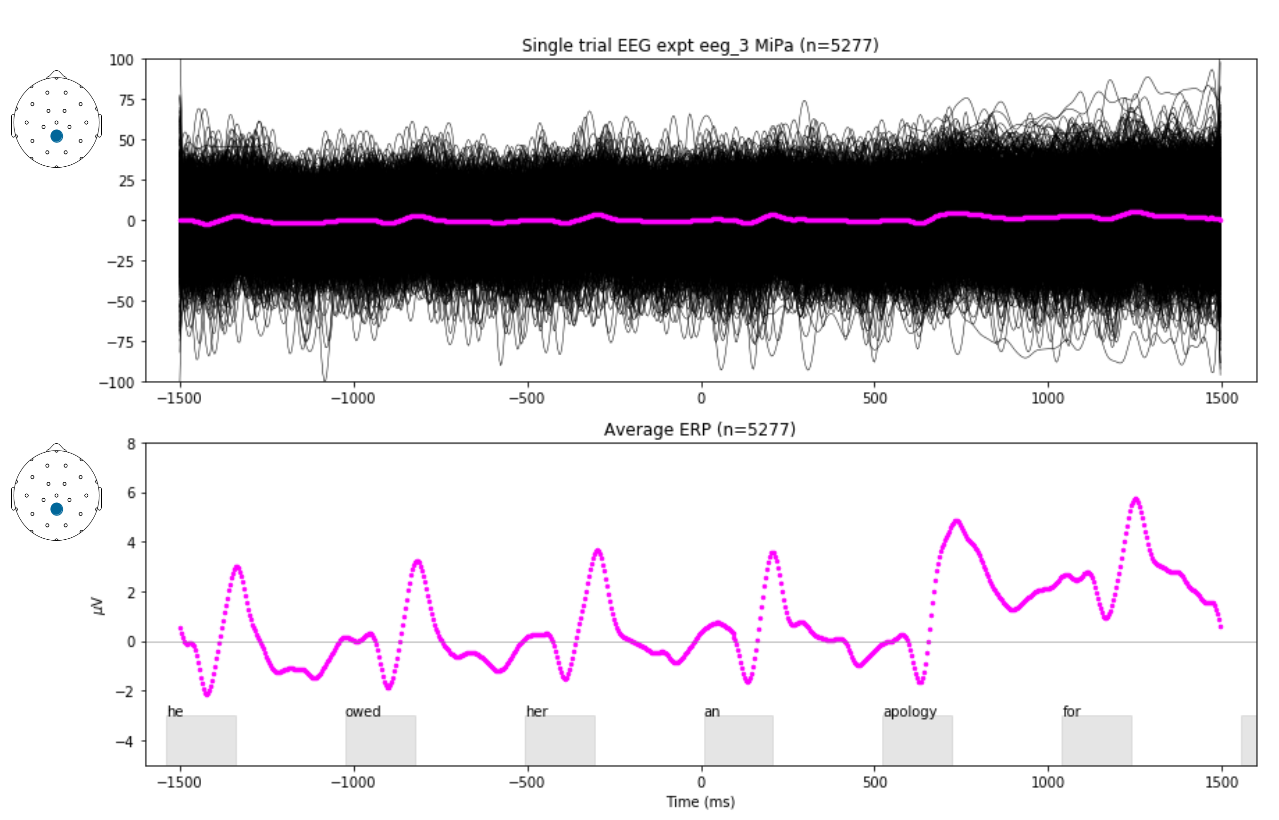
The time-domain average event-related brain potential (ERP) as shown below for visual words presented 2 per second is computed the same way.
Total running time of the script: ( 0 minutes 2.857 seconds)