Note
Click here to download the full example code
NOAA tides and weather epochs
This example wrangles about 10 years of somewhat messy hourly NOAA meteorological observations and water levels into tidy pandas.DataFrame of time-stamped epochs ready to load as fitgrid.Epochs for modeling.
1. Groom separate NOAA ocean water level and atmospheric observation data files and merge into a single time-stamped pandas.DataFrame.
Add a column of event tags that mark the high_tide time-locking events of interest.
3. Snip the time-series apart into fixed length epochs and construct a new column of time-stamps in each epoch with the high_tide event of interest at time=0.
Export the epochs data frame to save for later use in fitgrid
Data Source:
The water levels are measured relative to mean sea level (MSL). For further information about these data see tide data options, the Computational Technniques for Tidal Datums Handbook [NOS-CO-OPS2] and the NOAA Glossary.
import numpy as np
import pandas as pd
from matplotlib import pyplot as plt
import fitgrid as fg
from fitgrid import DATA_DIR

plt.style.use("seaborn-bright")
rc_colors = plt.rcParams['axes.prop_cycle'].by_key()['color']

np.random.seed(512)

# path to hourly water level and meteorology data
WDIR = DATA_DIR / "CO-OPS_9410230"

for pkg in [fg, np, pd]:
    print(pkg.__name__, pkg.__version__)
Out:
fitgrid 0.5.0.dev1
numpy 1.20.2
pandas 1.2.4
Clean and merge tide and weather data
The tides variable is the hourly water level measurements. The original date and time_(gmt) columns are converted to a pandas.Datetime and serve as the index for merging the water level data with the meteorological observations. Missing observations are coded NaN.
# read and tidy the NOAA water level .csv data files
tides = pd.concat(
    [pd.read_csv(tide_f, na_values='-') for tide_f in WDIR.glob('*msl_wl.csv')]
).drop(["Predicted (ft)", "Preliminary (ft)"], axis=1)

# sanitize the column names
tides.columns = [col.lower().replace(" ", "_") for col in tides.columns]

# make gmt date times usable
tides['date_time_gmt'] = pd.to_datetime(
    tides['date'] + ' ' + tides["time_(gmt)"]
)

# add local time at Scripps from the GMT
tides.insert(
    1,
    'hour_pst',
    (tides['date_time_gmt'] + pd.Timedelta(hours=-8)).dt.time.astype(str),
)

# drop unused columns
tides = tides.sort_values('date_time_gmt').drop(['date', 'time_(gmt)'], axis=1)

tides.rename(columns={"verified_(ft)": "water_level"}, inplace=True)

tides.set_index("date_time_gmt", inplace=True)
print(tides)
Out:
                     hour_pst  water_level
date_time_gmt
2010-08-01 00:00:00  16:00:00        -0.19
2010-08-01 01:00:00  17:00:00        -0.65
2010-08-01 02:00:00  18:00:00        -0.91
2010-08-01 03:00:00  19:00:00        -0.86
2010-08-01 04:00:00  20:00:00        -0.60
...                       ...          ...
2020-07-31 19:00:00  11:00:00          NaN
2020-07-31 20:00:00  12:00:00          NaN
2020-07-31 21:00:00  13:00:00          NaN
2020-07-31 22:00:00  14:00:00          NaN
2020-07-31 23:00:00  15:00:00          NaN

[87672 rows x 2 columns]
metobs are hourly meteorological observations from the same NOAA station.
metobs = pd.concat(
    [pd.read_csv(tide_f, na_values='-') for tide_f in WDIR.glob('*met.csv')]
)
metobs.columns = [
    col.strip().lower().replace(" ", "_") for col in metobs.columns
]
metobs['date_time_gmt'] = pd.to_datetime(metobs.date_time)
metobs = metobs.drop(
    ["windspeed", "dir", "gusts", "relhum", "vis", "date_time"], axis=1
)[["date_time_gmt", "baro", "at"]]

metobs.set_index("date_time_gmt", inplace=True)
metobs.rename(columns={"baro": "mm_hg", "at": "air_temp"}, inplace=True)

print(metobs)
Out:
                      mm_hg  air_temp
date_time_gmt
2015-08-01 00:00:00  1014.5      70.7
2015-08-01 01:00:00  1014.1      70.9
2015-08-01 02:00:00  1014.2      70.5
2015-08-01 03:00:00  1014.6      70.3
2015-08-01 04:00:00  1014.9      70.2
...                     ...       ...
2012-07-31 19:00:00  1016.6      66.2
2012-07-31 20:00:00  1016.4      65.7
2012-07-31 21:00:00  1016.2      65.5
2012-07-31 22:00:00  1016.1      65.8
2012-07-31 23:00:00  1015.6      67.1

[80411 rows x 2 columns]
The data pandas.DataFrame has the time-aligned tide and atmospheric observations, merged on their datetime stamp. Missing data NaN in either set of observations triggers exclusion of the entire row.
data = tides.join(metobs, on='date_time_gmt').dropna().reset_index()

# standardize the observations
for col in ["water_level", "mm_hg", "air_temp"]:
    data[col + "_z"] = (data[col] - data[col].mean()) / data[col].std()

# add a column of standard normal random values for comparison
data["std_noise_z"] = np.random.normal(loc=-0, scale=1.0, size=len(data))
print(data)
Out:
            date_time_gmt  hour_pst  ...  air_temp_z  std_noise_z
0     2011-03-13 00:00:00  16:00:00  ...   -0.871403    -0.191787
1     2011-03-13 01:00:00  17:00:00  ...   -0.802071    -0.261455
2     2011-03-13 02:00:00  18:00:00  ...   -1.096733    -1.573892
3     2011-03-13 03:00:00  19:00:00  ...   -1.027401    -1.308858
4     2011-03-13 04:00:00  20:00:00  ...   -1.062067    -0.250011
...                   ...       ...  ...         ...          ...
65843 2019-12-31 19:00:00  11:00:00  ...   -0.472743     0.429557
65844 2019-12-31 20:00:00  12:00:00  ...   -0.212748     0.213207
65845 2019-12-31 21:00:00  13:00:00  ...   -0.160748     0.349343
65846 2019-12-31 22:00:00  14:00:00  ...    0.029915     0.287934
65847 2019-12-31 23:00:00  15:00:00  ...    0.844568     1.162087

[65848 rows x 9 columns]
set time=0 at high tide
The fixed length “epochs” are defined as intervals around the time=0 “time-locking” event at high_tide defined by the local water-level maximum. Other time-lock events could be imagined: low-tide, high-to-low zero crossing etc.. Note that there are two high-tide events in each approximately 24 hour period.
# boolean vector True at water level local maxima , i.e., high tide
data['high_tide'] = (
    np.r_[
        False,
        data.water_level_z[1:].to_numpy() > data.water_level_z[:-1].to_numpy(),
    ]
    & np.r_[
        data.water_level_z[:-1].to_numpy() > data.water_level_z[1:].to_numpy(),
        False,
    ]
)

# these are just the high tide rows
print(data[data['high_tide'] == True])
Out:
            date_time_gmt  hour_pst  ...  std_noise_z  high_tide
2     2011-03-13 02:00:00  18:00:00  ...    -1.573892       True
5     2011-03-13 05:00:00  21:00:00  ...    -0.602190       True
10    2011-03-13 10:00:00  02:00:00  ...     0.808677       True
25    2011-03-14 01:00:00  17:00:00  ...    -0.430043       True
28    2011-03-14 04:00:00  20:00:00  ...    -1.655447       True
...                   ...       ...  ...          ...        ...
65794 2019-12-29 18:00:00  10:00:00  ...     0.184646       True
65808 2019-12-30 08:00:00  00:00:00  ...     0.802972       True
65819 2019-12-30 19:00:00  11:00:00  ...     0.855209       True
65833 2019-12-31 09:00:00  01:00:00  ...     1.228899       True
65844 2019-12-31 20:00:00  12:00:00  ...     0.213207       True

[5204 rows x 10 columns]
Define the epoch parameters: fixed-length duration, time-stamps, and epoch index.
In this example, the epoch duration is 11 hours, beginning 3 hours before the high tides time lock event at time stamp = 0.
Fixed-length duration. This is the same for all epochs in the data. In this example, the epoch is 11 hours, i.e., 11 measurements.#
Time stamps. This is an increasing sequence of integers, the same length as the epoch. In this example the data are time-stamped relative to high-tide at time=0, i.e., \(-3, -2, -1, 0, 1, 2, 3, 4, 5, 6, 7,\).
Assign each epoch an integer index that uniquely identifies it. The indexes can be gappy but there can be no duplicates. In this example the epoch index is a simple counter from 0 to the number of epochs - 1.
# 1. duration defined by the interval before and after the time lock event
pre, post = 3, 8

# 2. sequential time stamps
hrs = list(range(0 - pre, post))

# 3. epoch index is a counter for the high tide events.
n_obs = len(data)
ht_idxs = np.where(data.high_tide)[0]

# pre-compute epoch slice boundaries ... note these start-stop
# intervals may overlap in the original data
epoch_bounds = [
    (ht_idx - pre, ht_idx + post)
    for ht_idx in ht_idxs
    if ht_idx >= pre and ht_idx + post < n_obs
]

epochs = []
for start, stop in epoch_bounds:
    epoch = data.iloc[
        start:stop, :
    ].copy()  # slice the epoch interval from the original data
    epoch['epoch_id'] = len(epochs)  # construct
    epoch['time'] = hrs
    epochs.append(epoch)

epochs_df = pd.concat(epochs).set_index(['epoch_id', 'time'])
epochs_df.head()
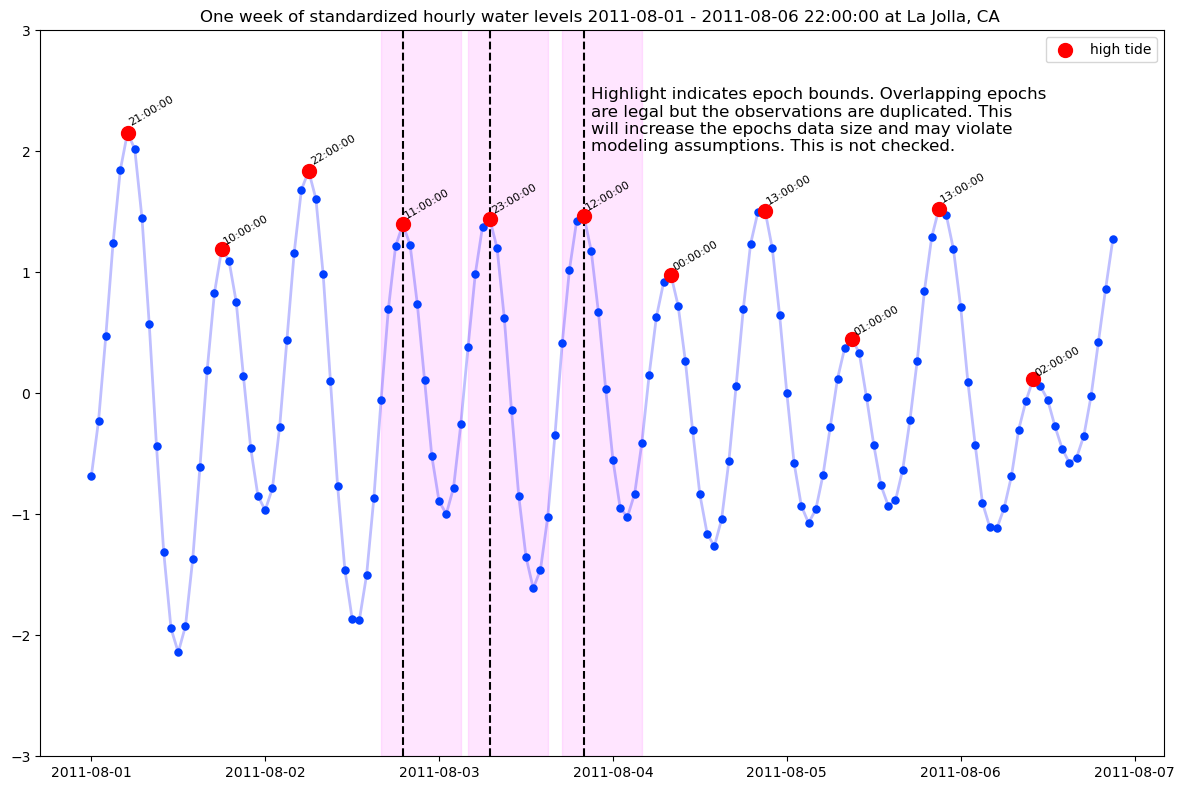
Visualize the epochs
dt_start, dt_stop = '2011-08-01', '2011-08-06 22:00:00'
aug_01_07_11 = data.query(
    "date_time_gmt >= @dt_start and date_time_gmt < @dt_stop"
)
print(aug_01_07_11)

f, ax = plt.subplots(figsize=(12, 8))
ax.set(ylim=(-3, 3))
ax.plot(
    aug_01_07_11.date_time_gmt,
    aug_01_07_11.water_level_z,
    lw=2,
    alpha=0.25,
    ls='-',
    marker='.',
    markersize=10,
    color='blue',
)

ax.plot(
    aug_01_07_11.date_time_gmt,
    aug_01_07_11.water_level_z,
    marker='.',
    markersize=10,
    lw=0,
)

ax.scatter(
    aug_01_07_11.date_time_gmt[aug_01_07_11.high_tide == True],
    aug_01_07_11.water_level_z[aug_01_07_11.high_tide == True],
    color='red',
    s=100,
    zorder=3,
    label="high tide",
)

for day, (_, ht) in enumerate(
    aug_01_07_11[aug_01_07_11.high_tide == True].iterrows()
):
    txt = ax.annotate(
        str(ht.hour_pst),
        (ht.date_time_gmt, ht.water_level_z),
        (ht.date_time_gmt, ht.water_level_z * 1.02),
        ha='left',
        va='bottom',
        fontsize=8,
        rotation=30,
    )
    if day in [3, 4, 5]:
        ax.axvline(ht.date_time_gmt, color='black', ls="--")
        ax.axvspan(
            ht.date_time_gmt - pd.Timedelta(pre, 'h'),
            ht.date_time_gmt + pd.Timedelta(post, 'h'),
            color='magenta',
            alpha=0.1,
        )
        if day == 5:
            ax.annotate(
                xy=(ht.date_time_gmt + pd.Timedelta(hours=1), 2.0),
                s=(
                    "Highlight indicates epoch bounds. Overlapping epochs\n"
                    "are legal but the observations are duplicated. This\n"
                    "will increase the epochs data size and may violate\n"
                    "modeling assumptions. This is not checked."
                ),
                size=12,
            )


ax.set_title(
    f"One week of standardized hourly water levels {dt_start} - {dt_stop} at La Jolla, CA "
)
ax.legend()
f.tight_layout()
Out:
           date_time_gmt  hour_pst  ...  std_noise_z  high_tide
3274 2011-08-01 00:00:00  16:00:00  ...    -0.512011      False
3275 2011-08-01 01:00:00  17:00:00  ...    -0.443541      False
3276 2011-08-01 02:00:00  18:00:00  ...    -0.015118      False
3277 2011-08-01 03:00:00  19:00:00  ...    -0.392791      False
3278 2011-08-01 04:00:00  20:00:00  ...    -0.939701      False
...                  ...       ...  ...          ...        ...
3411 2011-08-06 17:00:00  09:00:00  ...    -0.980359      False
3412 2011-08-06 18:00:00  10:00:00  ...     1.254577      False
3413 2011-08-06 19:00:00  11:00:00  ...     0.111521      False
3414 2011-08-06 20:00:00  12:00:00  ...    -0.481735      False
3415 2011-08-06 21:00:00  13:00:00  ...    -0.033335      False

[142 rows x 10 columns]
/home/runner/work/fitgrid-dev/fitgrid-dev/docs/source/gallery/1_epochs_data/noaa_csv_to_epochs.py:266: MatplotlibDeprecationWarning: The 's' parameter of annotate() has been renamed 'text' since Matplotlib 3.3; support for the old name will be dropped two minor releases later.
  ax.annotate(
The tidied fixed-length, time-stamped epochs data may be saved for re-use as data tables.
# export time-stamped epochs for loading into fitgrid.Epochs
epochs_df.reset_index().to_feather(DATA_DIR / "CO-OPS_9410230.feather")
Total running time of the script: ( 0 minutes 11.096 seconds)