Note
Click here to download the full example code
Ordinary least squares andlinear mixed-effects: minimal examples
OLS and mixed-effect models are specified by model formulas. The results returned by statstmodels for OLS and lme4::lmer for mixed-effcts models populate the FitGrid[time, channels] object. The FitGrid can be sliced by times or channels with pandas index slicing. The results are accessed via the fit object attributes and returned as a pandas.DataFrame or another FitGrid
Generate simulated data and load fitgrid.Epochs
import fitgrid

epochs_df = fitgrid.generate(
    n_samples=6, n_channels=4, return_type="dataframe"
)
epochs_df.set_index(["epoch_id", "time"], inplace=True)
epochs_fg = fitgrid.epochs_from_dataframe(
    epochs_df,
    epoch_id="epoch_id",
    time="time",
    channels=["channel0", "channel1"],
)
Ordinary least squares (OLS)
These models are specified with patsy Python formulas like lm in R. The results come back from statsmodels
lm_grid = fitgrid.lm(epochs_fg, RHS='1 + categorical + continuous', quiet=True)
Query and display OLS parameters
lm_grid.params
Query and display praameter standard errors
lm_grid.bse
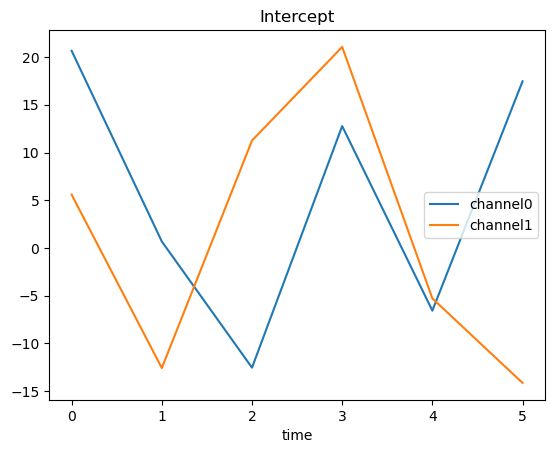
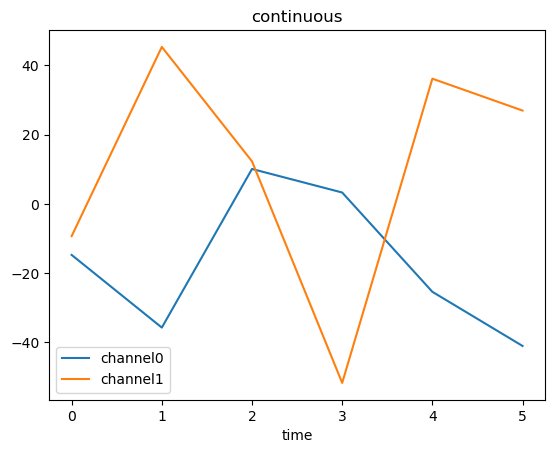
params = lm_grid.params
params.index = params.index.set_names(["time", "params"])
for param, vals in params.groupby("params"):
    ax = vals.reset_index("params", drop=True).plot()
    ax.set_title(param)
![categorical[T.cat1]](../../_images/sphx_glr_lm_lmer_minimal_002.png)
Linear mixed effects (LMER)
These models are specified with lme4::lmer R formulas and the results come back as pymer4 objects from the lmer results.
Fit a mixed-effects model with lme4::lmer via pymer4
lmer_grid = fitgrid.lmer(
    epochs_fg, RHS='1 + continuous + (continuous | categorical)', quiet=True
)
Query and display some lme4::lmer fit results
lmer_grid.coefs
Total running time of the script: ( 0 minutes 7.377 seconds)