Note
Click here to download the full example code
EEG sample epochs
These are the EEG data used in Workflow Outline
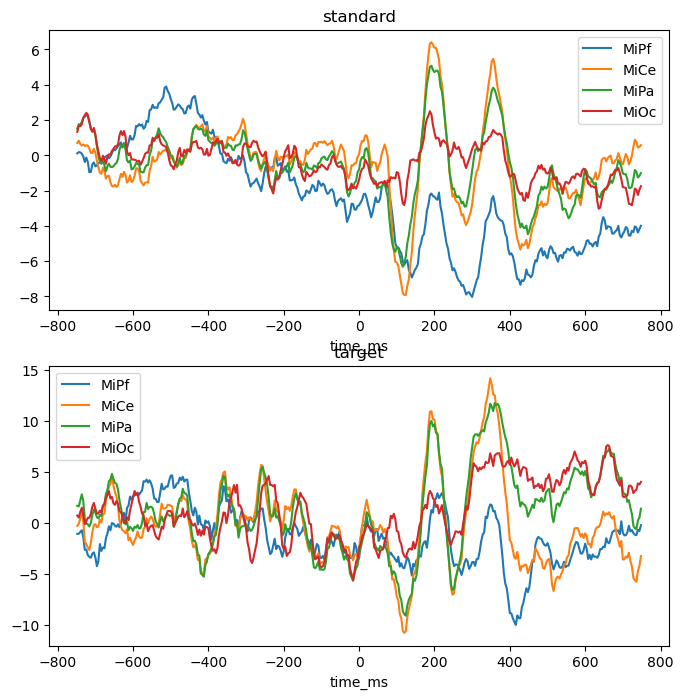
Experimental design. These data are single-trial EEG epochs recorded at 250 digital samples per second from one individual in an auditory “oddball” paradigm. The stimuli are a random sequence of high and low pitched tones (tone: hi, lo) that are frequent or infrequent (stim: standard, target). Stimulus trials are presented in two blocks: the hi tones are the infrequent targets in the first block and frequent standards in the second. The task is to respond to the infrequent tones. In this type of paradigm, the average potentials recorded over central and posterior scalp after about 300 ms post-stimulus are typically more positive going for the rare targets than for the frequent standards, a P300 ERP effect.
from matplotlib import pyplot as plt
import pandas as pd
from fitgrid import DATA_DIR, sample_data


# download the epochs data and read into a pd.DataFrame
sample_data.get_file("sub000p3.ms1500.epochs.feather")
p3_epochs_df = pd.read_feather(DATA_DIR / "sub000p3.ms1500.epochs.feather")

# select the experimental stimulus trials for modeling
p3_epochs_df = p3_epochs_df.query("stim in ['standard', 'target']")

# look up the data QC flags and select the good epochs
good_epochs = p3_epochs_df.query("match_time == 0 and log_flags == 0")[
    "epoch_id"
]
p3_epochs_df = p3_epochs_df.query("epoch_id in @good_epochs")

# the original time stamp column name is obscure, rename for clarity
p3_epochs_df.rename(columns={"match_time": "time_ms"}, inplace=True)

# select columns of interest for modeling
indices = ["epoch_id", "time_ms"]
predictors = ["stim", "tone"]  # stim=standard, target; tone=hi, lo
channels = ["MiPf", "MiCe", "MiPa", "MiOc"]  # midline electrodes
p3_epochs_df = p3_epochs_df[indices + predictors + channels]

# set the epoch and time column index for fg.Epochs
p3_epochs_df.set_index(["epoch_id", "time_ms"], inplace=True)

# "baseline", i.e., center each epoch on the pre-stimulus interval
centered = []
for epoch_id, vals in p3_epochs_df.groupby("epoch_id"):
    centered.append(
        vals[channels] - vals[channels].query("time_ms < 0").mean()
    )
p3_epochs_df[channels] = pd.concat(centered)

# done ...
p3_epochs_df
These time-domain average ERPs can be computed with fitgrid, see Average ERPs with fitgrid.
fig, axs = plt.subplots(2, 1, figsize=(8, 8))
for axi, (condition, vals) in enumerate(p3_epochs_df.groupby("stim")):
    vals.groupby("time_ms").mean().plot(ax=axs[axi])
    axs[axi].set_title(f"{condition}")
Total running time of the script: ( 0 minutes 1.643 seconds)