Note
Click here to download the full example code
Quick start
import pandas as pd
import fitgrid as fg
1. Read or construct a 2-D pandas.DataFrame of
time-stamped epochs with time series observations in rows and variables in columns.
from fitgrid import sample_data, DATA_DIR

# fitgrid built-in sample data download
p3_f = "sub000p3.ms1500.epochs.feather"
sample_data.get_file(p3_f)

# read as a pandas.DataFrame
p3_df = pd.read_feather(DATA_DIR / p3_f)
p3_df["time_ms"] = p3_df["match_time"]

# EEG quality control (specific to these data)
good_epoch_ids = p3_df.query("time_ms == 0 and log_flags == 0")["epoch_id"]
p3_df = p3_df.query("epoch_id in @good_epoch_ids")

# select EEG channels ("left hand side") and predictor variables ("right hand side")
columns_of_interest = [
    "epoch_id",
    "time_ms",  # index columns
    "MiPf",
    "MiCe",
    "MiPa",
    "MiOc",  # EEG
    "stim",
    "tone",  # predictors
]
p3_df = p3_df[columns_of_interest].query("stim in ['standard', 'target']")
p3_df
Out:
downloading ./fitgrid/data/sub000p3.ms1500.epochs.feather from https://zenodo.org/record/3968485/files/ ... please wait
Load the epochs data into an
Epochsobject for modeling.
p3_df.set_index(['epoch_id', 'time_ms'], inplace=True)
p3_epochs_fg = fg.epochs_from_dataframe(
    p3_df,
    epoch_id='epoch_id',
    time='time_ms',
    channels=['MiPf', 'MiCe', 'MiPa', 'MiOc'],
)
Fit a model (formula) to the observations at each timepoint and channel.
lm_grid = fg.lm(
    p3_epochs_fg,
    RHS="1 + stim",
    LHS=["MiPf", "MiCe", "MiPa", "MiOc"],
    quiet=True,
)
4. The FitGrid[times, channels]
object is a container for the model fits.
Out:
375 by 4 LMFitGrid of type <class 'statsmodels.regression.linear_model.RegressionResultsWrapper'>.
Slice it like a dataframe by times and/or channels
lm_grid[-200:600, ["MiCe", "MiPa"]]
Out:
201 by 2 LMFitGrid of type <class 'statsmodels.regression.linear_model.RegressionResultsWrapper'>.
Access attributes by name like a single fit.
The results come back as a pandas.DataFrame or another
FitGrid[times, channels].
# estimated predictor coefficients (betas)
lm_grid.params
# coefficient standard errors
lm_grid.bse
# model log likelihood.
lm_grid.llf
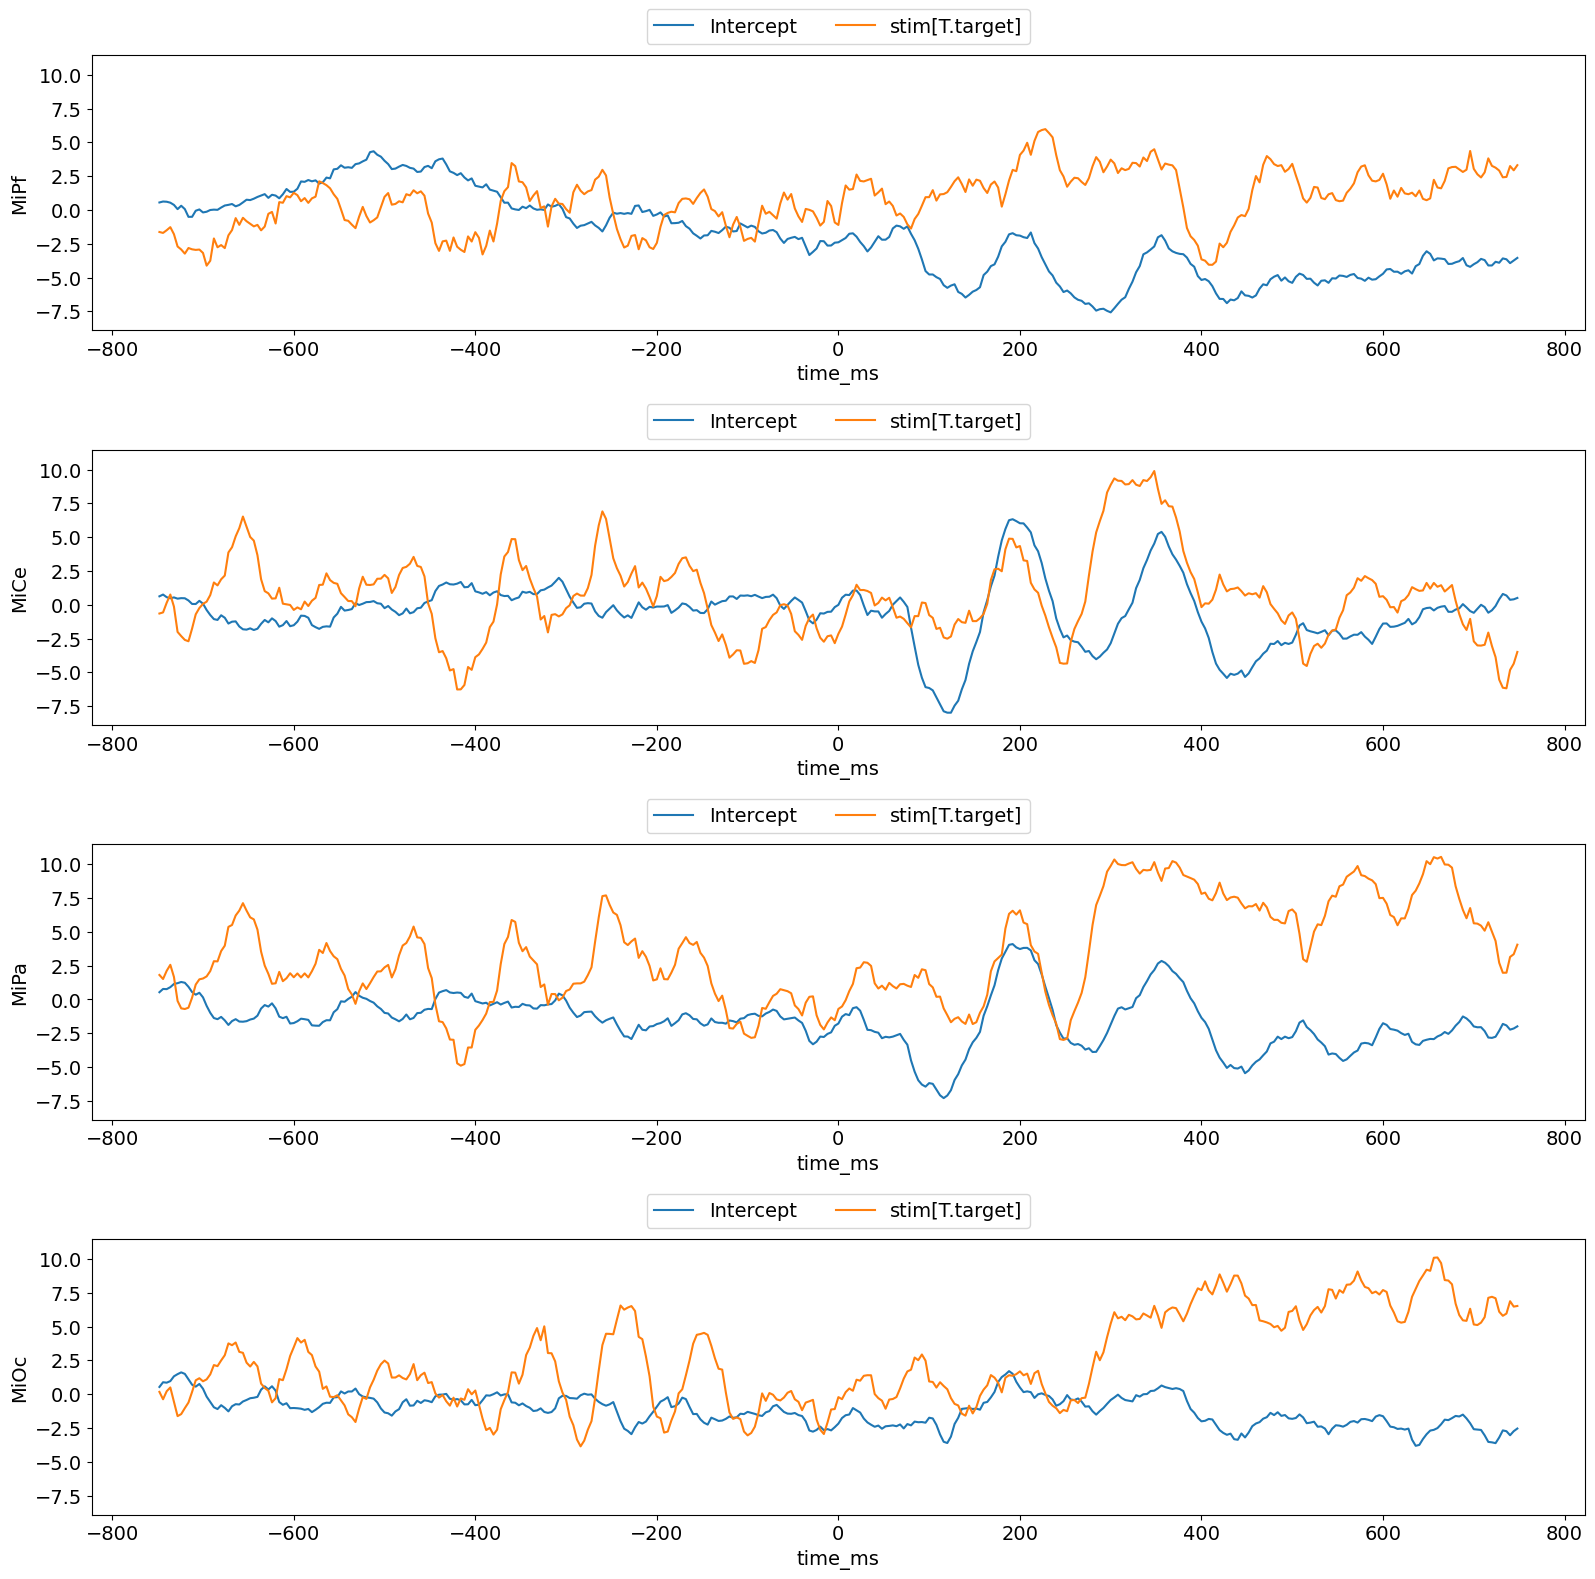
Plot results with a fitgrid built-in.
f, axs = lm_grid.plot_betas()

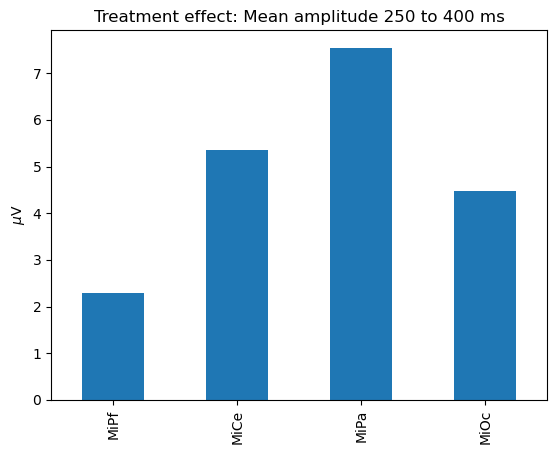
Or make your own with pandas, matplotlib, seaborn, etc..
# Slice a time range and compute means with pandas
p3_effect = lm_grid.params.loc[
    pd.IndexSlice[250:400, "stim[T.target]"], :
].mean()

ax = p3_effect.plot.bar()
ax.set_title("Treatment effect: Mean amplitude 250 to 400 ms")
_ = ax.set(ylabel="$\mu$V")

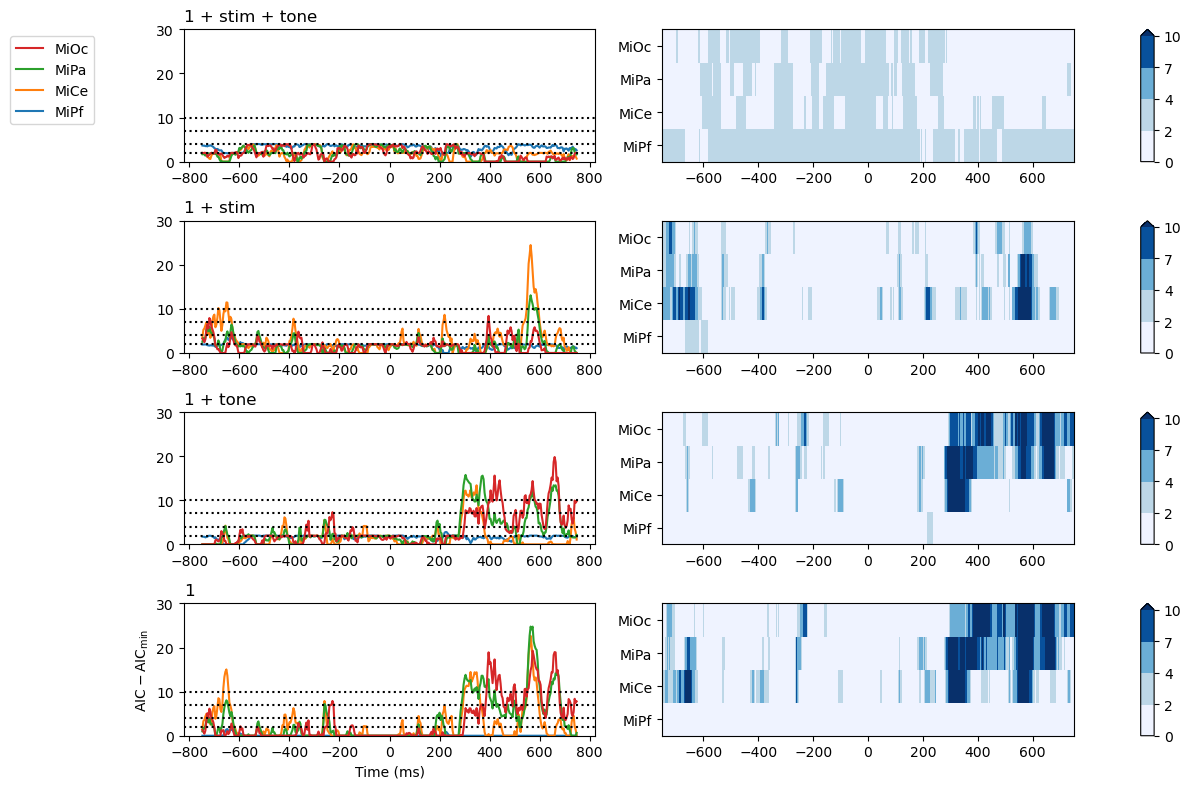
Compare grid summaries for models sets and pairs.
from fitgrid.utils import summary as fgs

p3_summaries = fgs.summarize(
    p3_epochs_fg,
    modeler="lm",
    RHS=["1 + stim + tone", "1 + stim", "1 + tone", "1"],
    LHS=["MiPf", "MiCe", "MiPa", "MiOc"],
    quiet=True,
)
p3_summaries
Out:
/home/runner/work/fitgrid/fitgrid/fitgrid/utils/summary.py:145: FutureWarning: fitgrid summaries are in early days, subject to change
  warnings.warn(
Compare models on Akiake’s information criterion (AIC) as the difference between the model’s AIC and the lowest in the set. Larger AIC differences indicate relatively less support for the model in comparison with the alternative(s).
fig, axs = fgs.plot_AICmin_deltas(p3_summaries)
for axi in axs:
    axi[0].set(ylim=(0, 30))
axs[-1][0].set(xlabel="Time (ms)", ylabel="$\mathsf{AIC - AIC_{min}}$")
fig.tight_layout()

Total running time of the script: ( 1 minutes 34.488 seconds)